.webp)
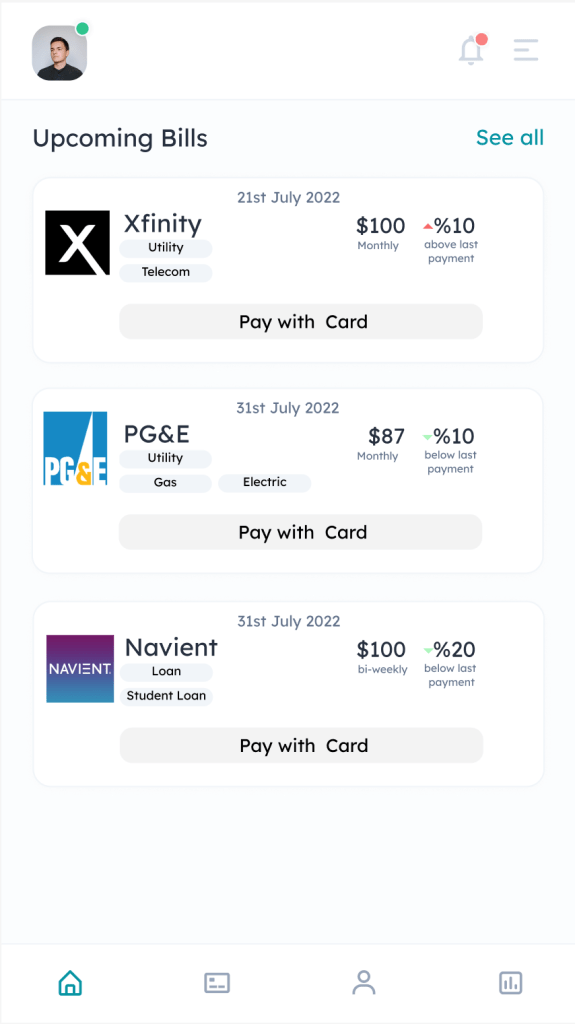
With pave.dev, building feature rich customer experiences can be as easy as making a simple API call. This post will show you how quick and easy it is to build a recurring expenditures dashboard using our Cashflow API.
Github Repo: https://github.com/Pave-Financial/pave-examples
Preview

Assumptions
We’ll be making the following assumptions in this post:
- You already have access to the pave.dev cashflow API.
- You have already uploaded some sample data to pave.dev.
- If either of these assumptions does not hold for you, please contact us at api@pave.dev
Technologies Used
- Redux – Redux makes it easy to have a predictable application state.
- React – Any modern frontend JavaScript will do. We’ll be using React bootstrapped with the create-react-app tool
Here’s what we’ll cover in this post:
- Basic Setup
- Implementing the HTTP API
- Creating visualizations with the recurring expenditures data.
Step 1: Setting up
You’ll need to make sure that you have the Node.js version 14 or greater installed on your development environment. Our example source code ships with a .devcontainer folder that takes advantage of the VS Code Remote Containers feature. This folder contains a portable development environment that contains all the prerequisites for running the development environment. You can find documentation on how to set this up on VS Code’s official documentation.
Step 2: Implement our HTTP API
We are including the basic implementation of the API here but we’ll be skipping over the minutiae of the Redux implementation.
If you’re interested in the implementation of the Redux stores and reducers, you can refer to our Github repository. You may find the following files to be useful:
The following code uses the fetch API and Redux actions to invoke the recurring expenditures API.
1import fetch from 'isomorphic-fetch'
2
3const { REACT_APP_API_KEY, REACT_APP_API_ENDPOINT } = process.env;
4function requestExpendituresActions() {
5 return {
6   type: FETCH_RECURRING_EXPENSES
7 }
8}
9
10function receiveExpendituresActions(json) {
11 return {
12   type: RECEIVE_RECURRING_EXPENSES,
13   data: json,
14   receivedAt: new Date()
15 }
16}
17
18export function fetchRecurringExpenditures(userId) {
19 const url = `${REACT_APP_API_ENDPOINT}/users/${userId}/recurring_expenditures`;
20
21 return function(dispatch) {
22   dispatch(requestExpendituresActions())
23   const options = {
24     method: 'GET',
25     headers: {'x-api-key': YOUR_API_KEY}
26   }
27
28   fetch(url, options)
29     .then((res) => res.json())
30     .then((json) => {
31       dispatch(receiveExpendituresActions(json))
32     })
33     .catch((err) => {
34       console.error(err); // eslint-disable-line
35     });
36 }
37}
If everything goes well, your API response should resemble the following output.
1{
2    "user_id": "user_123",
3    "from": "2017-07-31",
4    "to": "2019-08-01",
5    "recurring_expenditures": [
6        {
7            "type": "Utility",
8            "normalized_merchant_name": "Comcast",
9            "merchant_uuid": "MERCHANT_ID",,
10            "logo": "https://assets.pave.dev/merchants/logos/0002e1ce-e901-4715-bd9a-xxxxxxxxxxxx.png",
11            "last_amount": 184.78,
12            "last_description": "Comcast",
13            "last_date": "2019-07-30",
14            "avg_amount": 181.23,
15            "iso_currency_code": "USD",
16            "count": 24,
17            "avg_period_days": 30.7,
18            "normalized_frequency": "monthly",
19            "previous_amount": 184.78,
20            "previous_date": "2019-07-01",
21            "delta_amount": 0.0,
22            "delta_percent": 0.0
23        },
24        ...
25    ]
26}
Step 3: Create a Pie Chart
At this point, you should be able to consume the data in the display components. You can find the full implementations for all the charts and tables in our github repository. The code that displays the Pie Chart is located in src/pages/charts/ApexCharts. Our example uses ApexCharts, but you can use any chart library of your choosing.
Now that we have everything set up, let’s create our pie chart to visualize recurring expenditures by merchants.
// src/pages/charts/ApexCharts/Column.js

/**
* This Component renders spending by category
*/
import React from "react";
import Chart from "react-apexcharts";
import { connect } from "react-redux";
import {map, groupBy} from 'lodash';
import numeral from 'numeral'

const ColumnChart = ({ theme, recurringExpenditures }) => {

  // Group the data by transaction type
  const groupedData = groupBy(recurringExpenditures, (elem) => elem.type);

  const sourceData = groupedData ? groupedData : []
  // Sum up all the transactions for a specific type
  const data = map(sourceData, (expenditures, type) => {
    return {
      name: type,
      data: [expenditures.reduce((accumulator, current) => accumulator + (current.last_amount || 0), 0)]
    }
  })

  const options = {
    plotOptions: {
      bar: {
        horizontal: false,
        columnWidth: "25%",
        borderRadius: 8,
      }
    },
    chart: {
      type: 'bar',
      stacked: true,
      toolbar: {
        show: true
      },
    },
    dataLabels: {
      enabled: false
    },
    xaxis: {
      categories: [
        "Spending By Category",
      ]
    },
    yaxis: {
      title: {
        text: "$"
      },
      labels: {
        formatter: function (value) {
          return numeral(value).format('$0,0.00a');
        }
      }
    }
  };

  // Render the chart
  return (
    <div className="chart">
      <Chart options={options} series={data} type="bar" height="350" />
    </div>
  );
};

export default connect(store => ({
  theme: store.theme.currentTheme
}))(ColumnChart);
Your chart should look something like this:
That’s it! consuming the pave.dev Cashflow API is that simple. We’re excited to see what you can build with our API. If this looks interesting for you to try yourself, you can request access to our Sandbox here.


